
A website can look modern and attractive, offer engaging content, and still lose visitors time and again. The reason for this is that it loads too slowly, is slow to respond, or suddenly shifts important elements whilst loading – all of which indicate that something is amiss with the technical side of things. But how can you find out exactly where the problem lies? How do I know what data Google needs and checks when analysing my website? As an SEO agency , we need this information time and again for new projects.
This is exactly where Google PageSpeed Insights comes into play. This free and helpful tool checks individual webpages on both mobile and desktop versions. It not only displays a score between 0 and 100, but also provides specific, clear guidance on which technical aspects of the website can be improved and how this can be achieved. To do this, PageSpeed Insights combines a simulated test with data from actual usage, provided there is sufficient information available for the page being tested.

What is Google PageSpeed Insights?
PageSpeed Insights, or PSI for short, is an SEO analysis tool from Google, which is available free of charge. To check a page, simply enter the relevant URL. After a few moments, a comprehensive, albeit highly technical, report appears for both the mobile and desktop versions of the website. This report is highly relevant, as the assessment is provided by Google’s own system. In other words, the ‘teacher’ is already telling you what mark your website has achieved in terms of SEO.
The key question is: how quickly and easily can the page be used?
It’s not just about how many seconds a website takes to load in total and which sections contribute to this loading time. PageSpeed Insights also examines when the most important content becomes visible, how quickly the page responds to a click, and whether text, images or buttons shift position whilst the page is loading. Unless you’re technically savvy, this analysis can be rather challenging.
In short: the tool doesn’t just show that a page is slow. It also helps to pinpoint the possible cause.
Using PageSpeed Insights with AI agents
We’re already embracing this new era of technology and implementing PageSpeed Insights analysis with our AI agents.
We pass the relevant URL from the analysis to our agents, such as Openclaw, Hermes or Claude, and analyse the priorities for implementation. This tells us what needs to be done. In the best-case scenario, thanks to the integration with the agent, this work can already be carried out by the agent itself.
How the PageSpeed analysis works
PageSpeed Insights works with two different types of data: field data and lab data.
The field data comes from the Chrome User Experience Report, also known as CrUX. This consists of aggregated data on the experiences of real Chrome users over the past 28 days. This data shows how a website actually performs across different devices (mobile or desktop), internet connections and everyday scenarios. However, it is only displayed if sufficient usage data is available for the page being analysed. For new or low-traffic websites, this section may therefore be missing. This can take up to 30 days in each case.
Lab data, on the other hand, is generated using Lighthouse. Google loads the page in a controlled test environment and analyses its performance. The advantage is that technical issues can be identified specifically. The disadvantage is that a single lab test does not reflect every real-world usage scenario.
Both areas are important. The field data reflects the experience of real users. The lab data helps to identify technical causes.
What does the PageSpeed Score mean?
The best-known part of the report is the performance score, which ranges from 0 to 100. This is displayed in different sections. The presentation is reminiscent of a traffic light:
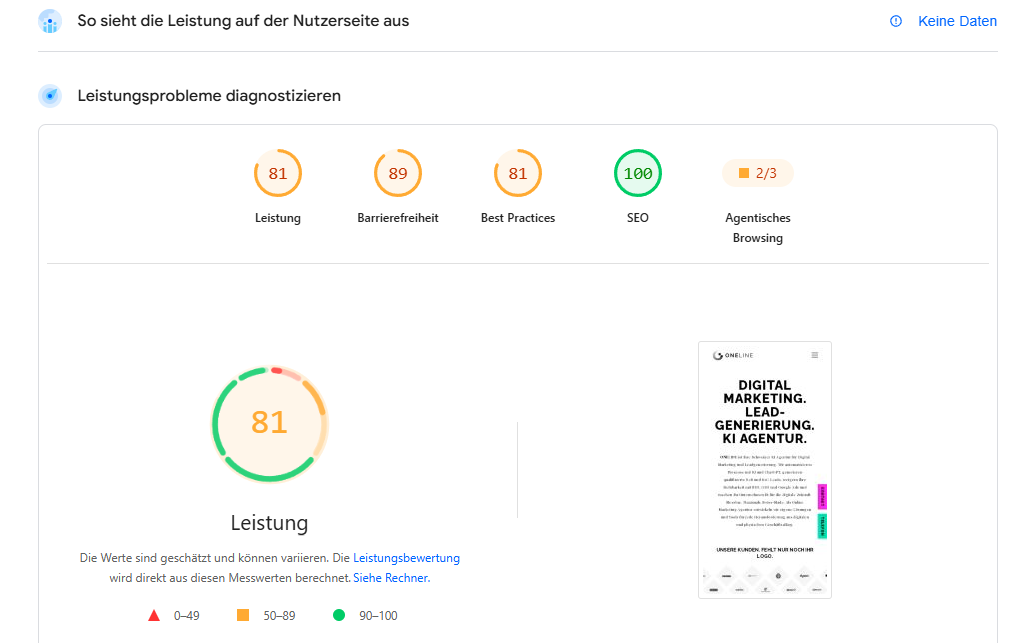
A score of 90 or above is considered good and is displayed in green. Scores between 50 and 89 indicate room for improvement. If the result is below 50, PageSpeed Insights classifies the performance as poor. This should definitely be addressed as soon as possible to avoid being penalised by Google in organic search results. Essentially, optimising this performance is aimed solely at improving SEO rankings.
However, this is where a common misunderstanding arises: the PageSpeed Score is not a school mark for the entire website.
A score of 100 does not automatically mean that a website is perfect in every respect. Conversely, a lower score does not mean that the entire site needs to be redeveloped. The score is primarily an indication that certain technical aspects should be examined more closely. However, we assume that certain challenges and errors are reflected across the board, and so this analysis is indeed relevant to the entire website.
Furthermore, the result may vary slightly from one test to the next. Google cites, amongst other things, differences in network conditions, available hardware and current load as possible reasons. A site should therefore be checked several times and not judged on the basis of a single test.
The three Core Web Vitals explained simply
The so-called Core Web Vitals are particularly important. These are three metrics that Google uses to assess a page’s loading performance, responsiveness and visual stability.
LCP: When does the most important content appear?
LCP stands for Largest Contentful Paint. This metric measures how long it takes for the largest visible element in the upper part of the page to load. This could be, for example, a large cover image, a banner or an eye-catching headline.
For a good user experience, this content should appear within 2.5 seconds. If it takes significantly longer, the page will seem slow, even if other elements have already loaded in the background.
INP: How quickly does the website respond?
INP stands for Interaction to Next Paint. This metric indicates how quickly a page responds to user interaction. This is usually also dependent on server performance, which can generally be upgraded.
If a visitor clicks on a menu, a button or a filter, the website should show a visible response as immediately as possible. A good INP value is below 200 milliseconds.
A page may already appear to be fully loaded, yet still feel slow. It is precisely these kinds of delays that the INP value highlights.
CLS: Does the page shift whilst loading?
CLS stands for Cumulative Layout Shift. This metric measures whether visible content shifts unexpectedly whilst the page is loading.
A typical example: A user wants to click on a button. Just before they do so, an image loads above the button and the entire content shifts downwards. Suddenly, the user clicks on the wrong element.
For good visual stability, the CLS value should be below 0.1.
What issues does PageSpeed Insights detect?
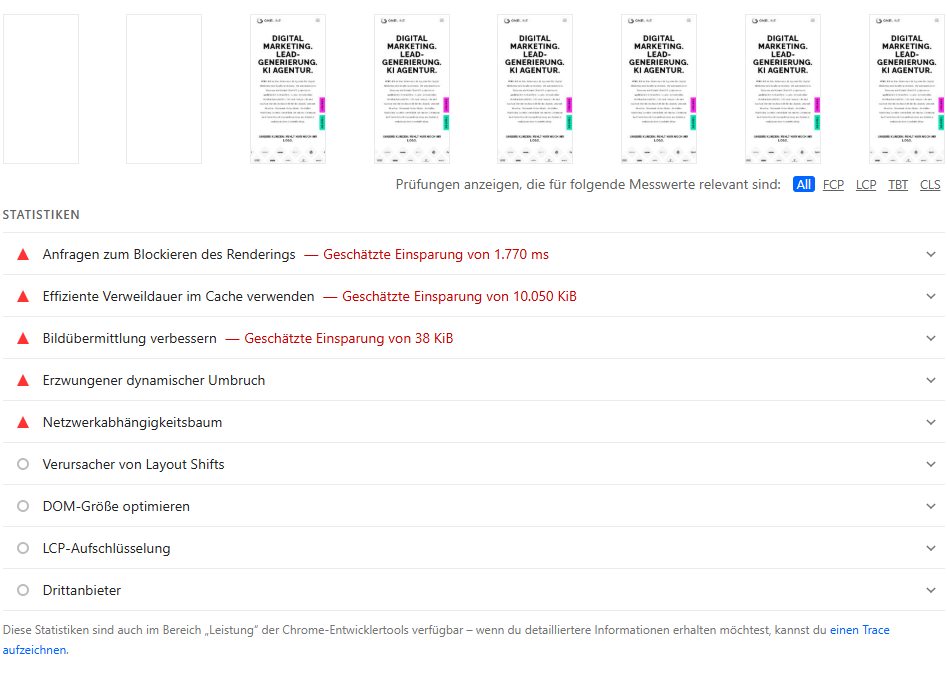
Below the metrics, PageSpeed Insights displays various optimisation suggestions and diagnostics. These suggestions are designed to help developers identify and prioritise the biggest performance bottlenecks on a page.
Typical issues include images that are too large or not optimally compressed, unused JavaScript and CSS code, resources that block the visible page rendering, or missing caching settings. For many of these issues, Lighthouse also shows how much data or loading time could potentially be saved.
However, it is important to note that PageSpeed Insights does not automatically fix the website.
The tool runs a diagnostic and provides recommendations. Which measures actually make sense depends on the content management system used, the page structure, the plugins employed and the business objectives.
A large cover image, for example, can be important for the impact of a landing page. The right solution is not necessarily to remove the image. It is often sufficient to optimise the file format, resolution or loading method.

Is PageSpeed Insights also important for SEO?
A fast website is, first and foremost, important for its visitors. Content loads more quickly, buttons respond faster and the overall user experience feels more pleasant.
The Core Web Vitals are also taken into account by Google Search’s ranking systems. Good scores can therefore contribute to success in the search results. However, they are only part of the overall picture. Relevant content, a clear page structure and the right answer to a search query remain crucial. A good PageSpeed score does not guarantee a top position on Google.
It is therefore not worth optimising solely for a green score.
The real goal is a website that is fast, stable and easy to use for visitors. A technical measure that improves the score by one point but compromises important functions is of little benefit to the company.
Common mistakes when using PageSpeed Insights
A common mistake is to test only the homepage. However, a website usually consists of different page types. A product page, a blog post and a landing page can be structured completely differently from a technical perspective. Therefore, particularly important and frequently visited pages should be checked individually.
The second mistake is simply chasing a score of 100. Not every recommendation carries the same weight. What matters is which issues affect real visitors and which measures deliver the greatest benefit.
The third mistake: ignoring the mobile analysis. Large images, animations and scripts in particular can be much more noticeable on a smartphone with a slower connection than on a high-performance office computer.
Finally, a single test should never be regarded as a definitive result. The analysis becomes more meaningful when several tests are carried out and existing field data is also taken into account.